Improve Mobile App Performance in Capacitor Apps
Updated: August 14, 2025
Some apps feel fast and smooth. Others feel slow and clunky. The difference is performance.
The first few seconds decide if a user stays or leaves. If your app lags, they’re gone.
Why your app feels slow and how to fix it#
A fast app builds trust. A slow app kills it. If your app stutters or takes too long to load, users get frustrated.
Many will uninstall before they even see what it can do.

This isn’t just about a first impression. It’s about keeping users.
Over half of people delete an app if it takes more than three seconds to load. Miss that window, and you’ve lost them before they even see what you built.
The fix? Stop guessing. Start measuring.
In a Capacitor app, data is your best weapon against performance issues.
Metrics that make or break your app#
Performance isn’t one thing. It’s a mix of signals that shape how your app feels.
In Capacitor apps, you need to track both web speed and native startup time.
These numbers are your starting point. Without them, you’re flying blind.
The table below shows the most important metrics. Know what they mean. Know why they matter. That’s how you build an app people keep using.
Metric | What measures | Why matters |
|---|---|---|
Startup time | Time from tapping the icon to the first usable screen. | Slow start = bad first impression. Users see the whole app as low quality. |
Time to Interactive (TTI) | Time until the UI responds to taps and scrolls. | Long TTI feels broken. Users tap, nothing happens, they leave. |
Crash rate | How often the app closes unexpectedly. | Crashes kill trust. They lead to uninstalls and bad reviews. |
Track these numbers over time. You’ll catch problems early and see if your fixes work.
The rule is simple: you can’t improve what you don’t measure.
Performance isn’t a one-time project. It’s a habit.
Common reasons of a slow app#
So, what does a slow app look like? In Capacitor, it often comes from running a web app inside a native shell.
You can find more information in our complete guide on how to build cross-platform mobile apps.
Watch for these signs:
A long, blank white screen before content loads.
Jerky animations or choppy scrolling.
A delay when tapping between screens.
Users saying it drains their battery fast.
Spotting the problem is step one.
This guide will show you how to fix it (using profiling tools, code-splitting, caching, and platform-specific tweaks), so your app goes from sluggish to slick.
How to find what's slowing your app down#
You can’t fix what you can’t measure. Guessing is the enemy of speed.
If you want to improve mobile app performance, use data, not hunches.
Profiling tools are your best friend. They’re built right into the native development environments.
A Capacitor app has two layers: web and native. The upside? You get pro-level tools from both.
You can debug the web side and also see how your app talks to the device hardware.
Your profiling toolkit for faster apps#
Think of these tools as your app’s health dashboard. They might look complex at first. But once you learn them, you’ll see exactly what’s happening under the hood.
For Capacitor projects, your core toolkit comes down to three profilers:
Chrome DevTools: Your window into the WebView. Track JavaScript execution, network calls, and rendering speed.
Android Studio Profiler: See how your app behaves on Android. Monitor CPU, memory, network, and battery use.
Xcode Instruments: The iOS counterpart. Find memory leaks, measure graphics performance, and trace app behavior.
Use them together.
A slow network request in DevTools might point to a plugin problem in Android Studio.
It’s all connected.
Uncovering Issues in the Android Studio Profiler#
Run your Capacitor app on an Android phone or emulator straight from Android Studio.
Then open the Profiler tab at the bottom.
This view becomes your command center.
You’ll see, in real time, how your app uses the phone’s CPU, memory, network, and battery.
It’s like watching a live heartbeat for your app. Easy to spot when something’s off.
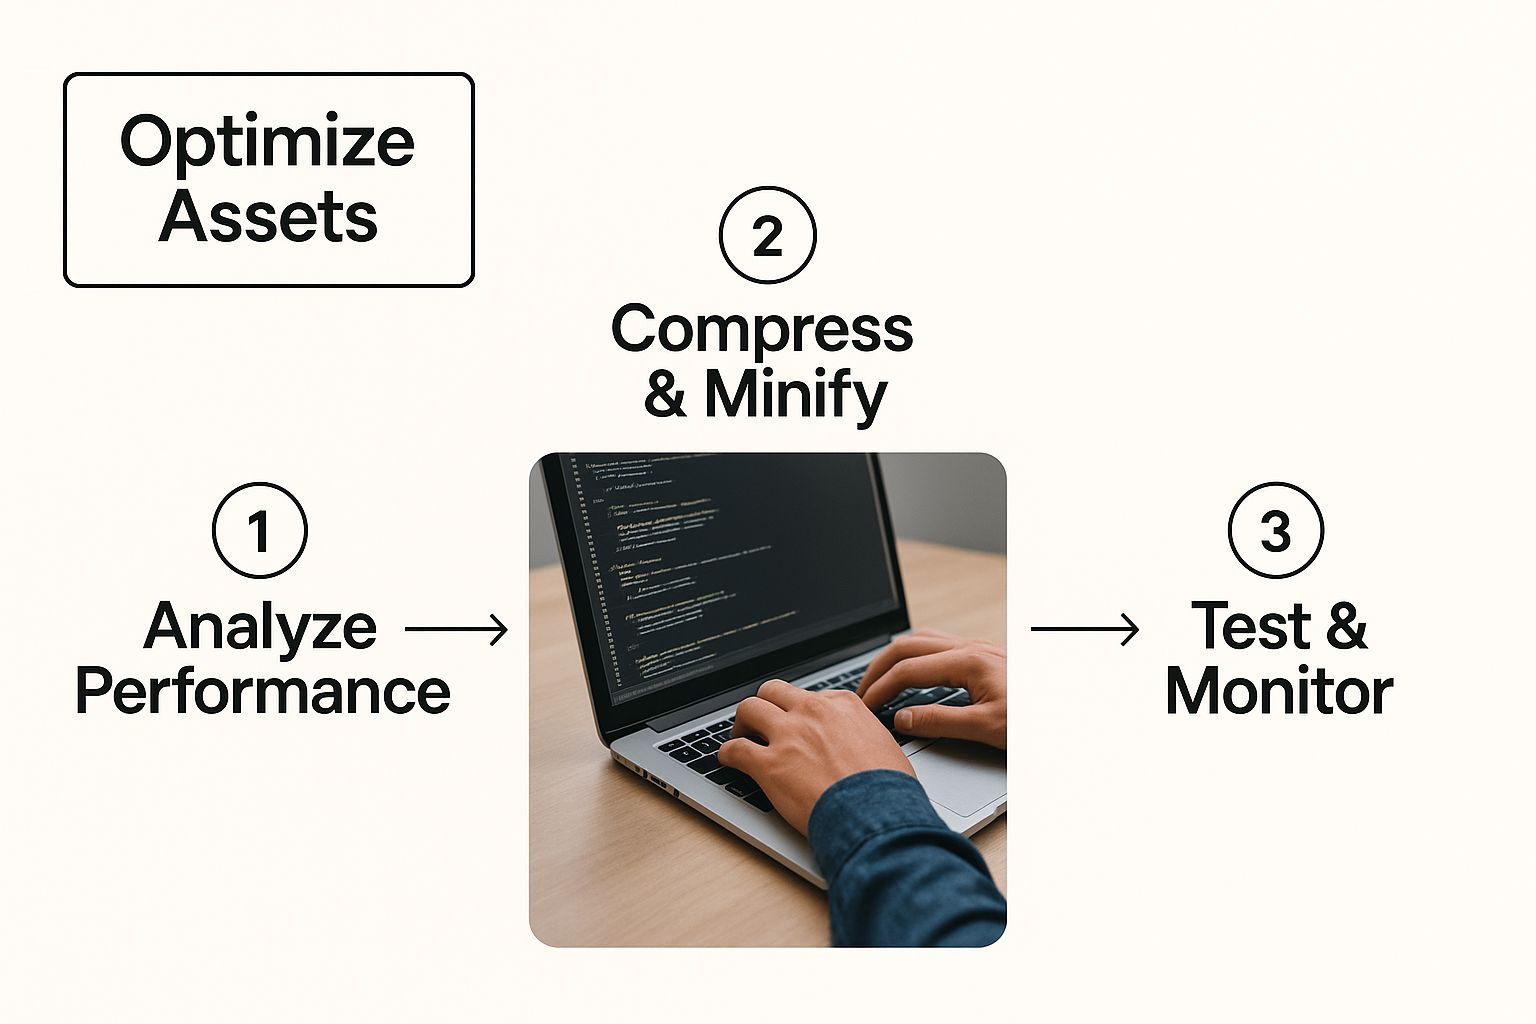
The profiler shows three lanes: CPU, memory, and network.
A long CPU spike is a big red flag, it usually means a process is running wild and draining the battery.
I start with the CPU timeline.
If the app is idle but the graph is spiking, something’s wrong. Click the spike to open a flame graph.
The widest bars show the functions eating the most time. Those are your prime targets for optimization.
This find-and-fix loop is how you turn a slow app into a fast one.
And a big part of that is trimming and optimizing your assets, you’ll see the results in these graphs.
Dig deeper with Xcode and Chrome#
On iOS, open Xcode’s Instruments. Use Time Profiler to check CPU usage. Use Allocations to hunt down memory leaks.
A memory leak happens when your app keeps holding onto memory it no longer needs.
Over time, that slows everything down and can cause crashes.
Run Allocations and watch the memory graph.
If it climbs and never drops, you’ve got a leak.
Instruments will trace it back to the exact objects and code causing the problem.
Key Takeaway: Don't just look for what's slow; look for what's wasteful. Unnecessary memory allocation and background CPU churn are silent performance killers that profiling tools are designed to expose.
For web issues, open the Performance tab in Chrome DevTools.
You can connect it to your app’s WebView on Android or iOS.
Hit Record, do something quick (scroll a list, switch pages), then stop and check the results.
Look for red “Long Task” blocks. These mean JavaScript is hogging the main thread and freezing the UI.
That’s where the jank comes from.
Also check the memory heap. Detached DOM nodes are a common cause of memory leaks in web apps.
Tooling matters when you’re choosing a framework.
If you're still deciding, you might find our breakdown of Capacitor vs React Native helpful in making a more informed decision.
By using these tools systematically, you turn the vague goal to improve mobile app performance into clear measurable steps.
You’ll find the exact function causing a CPU spike. The API call slowing the UI. The object hoarding memory.
Get your web code ready for native speed#
The speed of your Capacitor app comes down to the efficiency of your web code.
Your entire UI runs inside a WebView. Every line of JavaScript, CSS, and HTML affects startup time, responsiveness, and user happiness.
If you want to improve mobile app performance, treat your web code like native code.
Same attention to detail.
Stop thinking like a desktop developer. On mobile, you face weak CPUs and spotty connections.
The biggest mistake? Shipping one huge JavaScript bundle.
The device chokes trying to download, parse, and run it.
The fix? Be ruthless about what you load and when you load it.
This is where modern web frameworks and a few smart optimization techniques become your best friends.
Get aggressive with code splitting and lazy loading#
Don’t make users download code for screens they’ll never open.
Code splitting breaks your big bundle into smaller chunks. The app only loads what it needs, when it needs it.
Modern frameworks like Next.js and Angular do this for you.
In Next.js, file-system routing automatically splits code by page.
At launch, users only get the code for the first screen.
Fast and clean.
Lazy loading goes further.
It holds off on loading non-essential components (like a big chart or a modal) until the user actually needs them.
Split by route - make each major page its own chunk.
Lazy load components - load heavy elements only when needed.
Defer third-party scripts - Load analytics and chat after the app is ready.
Combine these and your initial bundle size drops fast.
That means a lower Time to Interactive (TTI) and no more endless white screen.
Aim for critical JavaScript under 170 kB compressed. That gives the device a real shot at loading and rendering quickly.
Shrink your assets with modern formats#
Images are often the heaviest thing in your app.
Oversized, unoptimized files slow everything down, especially on bad connections.
The goal: smallest file size that still looks great.
That means two things - pick the right format and serve the right size.
Use modern formats
WebP can cut file size by 25–35% compared to JPEG or PNG, with no visible loss in quality.
Both iOS and Android WebViews support it, so it’s a safe bet.
Serve responsive images
Don’t send a 1200px image to a 400px screen.
Use the <picture> element or the srcset attribute on your <img> tags to give the browser a menu of image sizes.
The WebView will choose the right one for the device, saving bandwidth and speeding up load time.
This isn’t optional. Responsive images are a must for any fast mobile web app.
For more tips on building a solid mobile experience from the ground up, take a look at our guide on mobile development best practices.
A faster app starts with a smaller DOM#
The DOM is the tree that holds your UI.
Every change makes the browser recalculate styles and layout.
If the DOM is big and deeply nested, those recalculations slow everything down and make the UI feel jerky.
Keep it lean and flat:
Fewer nodes - Stay under ~1,500 total. Check with Lighthouse.
Shallow depth - Avoid deep nesting; flat is faster.
Smart re-renders - in React, use
React.memoorPureComponentto skip unnecessary updates.
A small bundle, compressed assets, and a simple DOM work together to make your app feel fast, smooth, and native.
Optimize the native bridge and cache for speed#
In a Capacitor app, the native bridge is the link between your web UI and the phone’s features.
How you use it affects how fast your app feels.
Pair it with smart caching, and you can seriously improve mobile app performance.
Think of the bridge like a tollbooth.
Every time JavaScript talks to a native plugin, there’s a small performance “toll.”
If your app sends tiny messages nonstop (those tolls pile up) causing stutters and lag.
Design smarter plugin conversations#
Be less chatty.
Fewer, bigger bridge calls are faster than constant small ones.
It’s like grocery shopping, you don’t drive out for one apple, come home, then go back for milk.
Make one list and get it all in one trip.
Do the same with native bridge calls.
Batch your data - combine updates into an array or object, then send them in one go.
Build better plugin methods - let native methods accept complex data so one call does more.
Offload heavy work - push CPU-intensive tasks to the native side to keep the UI thread free.
This reduces overhead and boosts stability.
High-frequency bridge calls can crash your app, and 60% of users abandon an app after just a few crashes.
You can read more about how performance craters user retention on vwo.com.
Create a powerful caching layer#
Caching creates the illusion of instant speed.
Store data and assets on the device, and you cut out the network, the biggest performance bottleneck in most apps.
With Capacitor’s native file system access, you can go far beyond a normal browser cache.
Don’t just store API responses. Cache user states, pre-calculated data, even whole pre-rendered views.
Example: a social media feed.
Show what you have - on launch, display the cached feed from the last session so content appears instantly.
Fetch in the background - while the user scrolls, quietly grab the latest posts.
Merge and refresh - blend new data into the view without a full reload.
This “stale-while-revalidate” approach keeps the UI responsive from second one, even on bad or no connection.
Practical caching strategies to implement#
The best caching is layered.
Store different kinds of data for the biggest performance boost.
Cache Target | What to store | Why matters |
|---|---|---|
API responses | JSON from your backend | Cuts network lag, making navigation between screens feel instant. |
Static assets | Images, fonts, icons, thumbnails | Local caching makes them appear instantly, every time. |
User state | Preferences, session data, last viewed tab | Restores context instantly so it feels like they never left. |
Pre-computed data | Results from heavy calculations or merged API calls | Do the work once, then reuse it to save time and CPU. |
By combining quiet, efficient bridge communication with aggressive caching, you hit two of the biggest performance killers in hybrid apps at once.
That’s how you make a Capacitor app feel native and lightning-fast.
Apply platform-specific performance tweaks#

Optimizing your web code gets you most of the way there. The final polish comes from the native layer.
iOS and Android handle WebViews and system resources differently. A one-size-fits-all approach won’t get peak performance.
Think of these tweaks as your secret weapon.
Small, targeted changes in your native projects smooth out platform quirks and make your app feel right at home on any device.
Tweaking Android for a smoother experience#
Android’s variety is both its power and its pain.
Different devices, OS versions, and hardware mean performance is all over the place.
Capacitor lets you configure the WebView and native settings directly.
Start with hardware acceleration. It’s usually on by default, but check yourAndroidManifest.xml to be sure:
<application...android:hardwareAccelerated="true">...
This offloads rendering to the GPU, making animations smoother and reducing jank, especially on budget devices.
Next, consider a custom WebView subclass in your native code.
You can fine-tune caching policies, enable extra features, and squeeze more out of rendering.
Pro Tip: If your app has lots of text or complex layouts, enable algorithmic darkening on OLED screens. It makes dark mode more efficient than CSS filters and can even save battery.
Master performance on iOS#
iOS is more consistent than Android, but it has strict rules, especially around memory.
The WKWebView that powers Capacitor apps is fast, but it still needs tuning.
One common issue is the “white screen of death.”
It happens when iOS kills your web content for using too much memory.
To prevent it, make WKWebView more memory-conscious: adjust caching, and turn off unused features.
Also watch ScrollView behavior inside WKWebView.
Capacitor’s defaults are good, but you can tweak them for better control:
Disable bouncing - if you use custom scrolling or pull-to-refresh, turn off native bounce to avoid visual glitches.
Manage inset adjustment - Handle safe areas (notch, home indicator) so your UI isn’t hidden behind system elements.
Small, platform-specific tweaks add up to a polished experience.
Handling these details is part of the cross-platform game.
You can learn more by reading up on the common mobile app development challenges developers run into.
Use Capacitor config for easy tweaks#
Not every platform tweak needs native Java/Kotlin or Swift.
The capacitor.config.ts (or .json) file is your control center for cross-platform behavior.
Capacitor applies these settings to your native projects every time you run npx cap sync.
Here are a few handy performance-related settings you can control from there:
Config Property | Platform | What it does |
|---|---|---|
| Android | Disables the new Rust-based bridge if older plugins have issues. |
| iOS | Controls WebView content insets to manage safe areas and avoid the notch. |
| Both | Sets how long the splash screen shows; shorter feels faster. |
| Both | Limits which external URLs the WebView can load, good for performance and security. |
These small changes fine-tune the native shell your web app runs in.
They help close the gap between a web page and a truly native app, so it feels smooth on every device.
A few common questions about Capacitor performance#
As you start optimizing, a few questions always come up.
Getting them answered early will help you focus on the work that actually improves mobile app performance.
How much faster can my Capacitor app get?#
It depends on where you’re starting.
If you’ve got one giant JavaScript bundle and unoptimized images, the gains can be huge - 30–50% faster load times just from code splitting, lazy loading, and asset optimization.
But speed isn’t just about load time.
A snappy UI that reacts instantly feels far better than shaving 100ms off the splash screen.
Focus on user-first metrics like Time to Interactive (TTI) to see the real impact.
Will these optimizations make my code harder to maintain?#
Almost never. Most performance best practices lead to cleaner, more modular code.
Code splitting naturally forces logical, self-contained components. That’s good for speed, onboarding, and bug fixing.
Yes, there’s a small learning curve with native tools like Xcode Instruments or Android Studio Profiler, but the payoff in user satisfaction, scalability, and code health is worth it.
For more on that, check out our guide on mobile app quality assurance.
What is the single biggest mistake developers make?#
Treating the WebView like a desktop browser.
Mobile devices have:
Slower CPUs - a mobile processor simply can’t chew through JavaScript like a laptop.
Limited memory - go too heavy, and iOS will kill your web content.
Unreliable networks - big bundles crawl on weak 4G.
This is how you end up with bloated bundles, uncompressed images, and complex DOMs that cause endless re-renders.
Always build with a mobile-first performance mindset.
Ready to build high-performance mobile apps without the native learning curve?
NextNative gives Next.js developers everything they need - web flexibility, native power, and zero setup hassle.
Launch your production-ready iOS and Android app in days. Get started with NextNative.